Previously, you could display reports (e.g. income) on a daily, weekly, monthly or yearly basis. Now you have the ability to group quarterly.
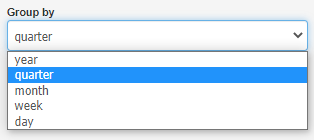
To see how this type of grouping works, go to Reports> Charts and change the Group by field to quarter; it is also worth changing the Date from field to e.g. the beginning of last year, then you will see a chart of income and expenses for the last quarters.